Category Archives: Uncategorized

End User Experience (EUX) or Customer Experience is Key to Digital Experience

April 23, 2018 | By: Colin Macnab, CEO

End User Experience

AppEnsure delivers Dynamic Demand Profiling to continuously optimize the Digital Experience.

It is a common but unfortunate challenge for IT Ops and App Delivery teams; complaints of long delays and lack of availability of mission critical apps are reported (if you are lucky), but it is very tough in a virtualized, distributed IT deployment to discover the root cause and resolution. While you may even be lucky enough to have a monitoring tool that advises of the delays, there is no way to relate it to the problem component or service in the IT stack. Maybe later when the firefighting is over, you may be able to look at the logs or monitoring alarms to try to correlate where the problem is located, but by then the demand has changed and there is no longer a problem to troubleshoot…rinse-repeat…daily!
With AppEnsure, you can now see the service degradation as it occurs and relate it to the specific root cause in real time, without reviewing logs or alarms. This unique capability is provided through Dynamic Demand Profiling, which relates the end user response experienced to every component of the IT stack involved in the delivery, end to end and hop by hop. AppEnsure uses the real traffic for the measurement of the latency of each component, not synthetic transactions or assembled infrastructure monitoring metrics, to deliver real time visibility of the real end user experience.
AppEnsure is able to remove 95% of the time and guess work in defining what the resolution of the problem is. This profiling continuously relates the real App demand to the ability of the stack to service the requests in the SLA required, so now user experience drives the necessary resource requirements rather than the other way round. Now back to that World Peace thing…

Announcing New Release 6.0

September 8, 2017 | By: AppEnsure

announcing new release 6.0

AppEnsure is adding more new features upping the tool’s value with its latest release of the software, for end user centric application performance management in Citrix deployments. We are very pleased to announce Release 6.0, evolving the solution to address service level guarantees to end users for published applications and virtual desktops.

With Release 6.0 AppEnsure provides:
      •  True end-to-end visibility through and beyond the Citrix silo
      •  Auto correlation of each user’s access of backend infrastructure
      •  Backend response time for each user for every application     accessed
      •  Response time and latency measured through the delivery layer
      •  Endpoint agents to further identify network latencies and endpoint issues
      •  URL Metrics
      •  Machine learning for diagnostics
AppEnsure identifies every user of every application and measures response time collectively for all users as well as for each user. AppEnsure measures the end user experience (EUX) in terms of response time and throughput to manage application performance. Uniquely, AppEnsure correlates EUX with the application delivery infrastructure performance providing IT Operations with the needed Application Operational Intelligence to manage service levels that maximize enterprise productivity and revenue generation. By measuring the end-to-end response time of real (not synthetic) transactions through the entire stack, AppEnsure provides contextual, actionable intelligence to reduce the resolution of application brownouts and blackouts.
The following picture illustrates the response time measured by AppEnsure providing end-to-end visibility.end to end visability

Based on many thousands of stored instances and rules, which are continually being incremented by machine learning, the root cause analysis of an event can be deterministically established. AppEnsure locates the route cause and location of the element or hop in which the latency has changed which triggers a proposed remedy for IT Ops to restore service to the Desired Service Level or SLA.

An AppEnsure generated alert is a notification that an event occurred.  Alarms are generated by AppEnsure when a set of related alerts are correlated and a potential root cause for the alerts can be diagnosed.root cause identification

Join the Ride

AppEnsure Release 6.0 is now available. To evaluate, please download here.


Delivering Impressive End User Experiences in Citrix Xen Upgrades – But not as an afterthought!

March 10, 2017 | By: Colin Macnab, CEO/Founder

End Users

Citrix XenApp and XenDesktop have been around for many years, delivering IT Ops an essential ability to centrally manage and control costs of App and VDI delivery. The move to a new architecture in Xen 6.X accelerated deployments and now the move to the latest improvements in Xen 7.X is in full swing. We see this occurring globally, with generally good results. However, during these last two upgrade cycles, we have also seen the Digital Transformation of businesses, making delivery of an impressive End User Experience (EUX) now one of the most important objectives of the upgrade process. We also see most upgrades following the tried and trusted legacy approach of, first deployment rollout, then performance monitoring and management. Unfortunately this approach is self-conflicting, performance as an afterthought is a legacy approach that has not resolved performance issues well post deployment. If EUX is the primary or an important objective, then it needs to be part of the planning and deployment process at the start, to achieve the desired results.

Oops, you did not approach your upgrade that way and now the users are complaining, the business is complaining and your management urgently wants IT to explain what all the time and money was spent on without resolving all the inefficient waiting that is the core complaint. Waiting to logon, waiting to access Apps, waiting for responses, waiting for the screen to refresh. Waiting! So, what to do to resolve this and deliver the performance that is now demanded by all. Often we see the application of legacy monitoring & management tools used in other parts of the stack to try to understand what the problems are. However, these tools were mostly architected before virtualization was part of the design remit. Recent revs to these tools cannot get past that initial architectural limitation, so they rarely resolve anything or present any new visibility into the issues. The waiting continues.

Citrix itself offers little to address these challenges, the recent End of Life of Edgesight was effectively their exit from addressing the subject. There are several 3rd party Citrix tools available that do address the subject, but they generally all are platforms for viewing the commodity data streams from Citrix and other sources in a single pane, not a source of real EUX measurements. While this can present some interesting observations, it does not rescind the old maxim, “commodity data gets you commodity results”. There are a couple of tools that actually do try to measure performance, but they use synthetic transactions, which is another way at guessing what the EUX might be, not an actual measurement of the real transactions and experience.

However, in the end all these tools fall under the influence of the mistaken belief that in a dynamic, distributed, virtualized IT stack, it is possible to collect enough metrics on the availability of various silos of technology; Citrix Servers, CPU, Storage, Networking, etc. and other feeds to infer what the EUX will be. You cannot, there will never be enough data to find the correct real result. Worse, as these deployments grow more and more complex with DevOps continuously evolving the Apps, it is getting exponentially more complex to even attempt this approach.

Further, the 3rd party tools available to monitor Citrix environments are confined to monitoring the Citrix silo only, a very incomplete and compartmentalized perspective. They provide large amount of data collected through API calls and PowerShell scripts from the underlying Citrix layers, but then require that subject matter experts review the logs after the fact and decipher the data to discover what is happening inside the Citrix silo. Therefore, these are not real time solutions. These solutions also fail to provide end-to-end visibility through the complete stack and the breakdown of that end to end visibility hop-by-hop. As a result, they assist establishing the fact that the end-user experience degradations are not the result of the Citrix silo, but fail to identify the actual root cause.

In some cases, these tools advise that an end user experience is degrading, but do not provide the reason behind it. Knowing your end user is having a bad experience is important for the Citrix administrator, but not knowing why they are having a bad experience is very frustrating. Since delivering optimal end-user experience involves many hops and layers, just knowing that there is a degraded delivery still requires that the Citrix administrators drill down even further into the various segments of the delivery, if they need to understand the root cause. This is the primary reason why end-user experience remains an unsolved mystery in Citrix environments.

At AppEnsure, we started with an entirely new approach, we measure the real response times of the actual transactions through the entire stack, end to end and hop by hop. We are measuring the actual time that an end user experiences for each transaction with the application at their screen, through the Citrix delivery tiers and into the backend Application tiers. We do also collect the metrics that others do, but we use that to confirm our root cause analysis results from our own deep measurements of real response times. We measure real milliseconds of EUX, not percentage availability of technical resources. This turns out to be the only way to do this and deliver real EUX results. Why doesn’t everybody do this, you might ask? Frankly, it is really hard and requires real technology, not just data collection capability. It has taken us years to develop, integrate and deliver this as an enterprise class product that provides real time answers using only 1-2% of resources while operating continuously.

This approach also provides multiple other benefits when engineered from the start:

  •  Auto discovery of all End Users and the Applications they are running
  •  Auto discovery and mapping of the complete stack and service topology without relying on (usually out of date) CMDBs
  • Auto baselining of response times for every user and transaction at any given time and date to give intelligent contextual alerting of EUX excursions
  • Auto correlation of events across the stack, without having to pull out logs and manually reviewing them
  • Auto presentation of logon, App access, screen refresh times, etc. for all users and all transactions
  • Auto root cause analytics with clear directions on where the problem is and who is being affected

None of this requires any configuration out of the box, though there is a complete console for those who want specific conditions for their environment. There are multiple report generation options, though with Rest APIs, JSON Inserts, SNMP Traps, Excel, email and text alerting, all the data can be imported into your own reporting environment. Further, as we never open the payload, there is not much to collect, each agent generates about 1 MB/hour of the metadata we create.

In summary, we have developed the fastest way IT Ops can proactively stop or find issues, reducing time to resolution by over 95% in most cases, with the lowest false positive and false negative results. That is the foundation to delivering an impressive end user experience. Please give us a brief 20-30 minutes on a call to demonstrate these capabilities to you live and confirm how you can lose wait that does not come back.

The End-User Experience Enigma: The Continuing Performance Puzzle Saga in Citrix Environments

March 3, 2017 | By: Sri Chaganty, CTO/Founder

puzzle

With over 400K customers, Citrix is defining the digital workspace that securely delivers Windows, Linux, web, SaaS apps, and full virtual desktops to any device, anywhere.  Citrix administrators at all these customers are the frontline for addressing dissatisfied end users of those applications and desktops.  Unfortunately, even today, understanding real end-user experience in Citrix environments remains an unsolved puzzle.

AppEnsure conducted various surveys in the last six months and discovered some very consistent complaints that have been voiced over many years regarding end-user experience in Citrix environments.

With the rapid enhancements that Citrix is introducing in its frequent releases of XenApp/XenDesktop since 6.5 was introduced (recently 7.13 was made available), a new set of visibility and performance optimization challenges are being introduced. Left unaddressed, these limit the Citrix administrators’ ability to understand, diagnose and improve the end-user experience of the delivery. From our surveys, it became evident, as the chart below illustrates, that Citrix administrators do not have the appropriate tools to readily identify performance issues affecting the end-user experience.

Survey result

Even in circumstances where Citrix administrators are using multiple tools, there is the lack of visibility needed to solve performance issues with end-user experiences.  Hence many administrators, not satisfied with the existing monitoring solutions that they have in place, are searching for new solutions with more effective technology to quickly resolve these issues.

Surveys result 2

However, when applications and desktops are delivered over Citrix, the Citrix administrators in fact become the front-line for responding to all end-user complaints about slow performance, whatever the cause.

The common complaints that Citrix administrators receive from end-users have been very consistent over the years.  Our survey confirmed the fact that most of the time Citrix administrators are fighting fires to address the common problems and just to prove that it is not “Citrix issue”, rather than trying to discover and resolve the actual root cause of the problem.

survey result 3

Typically, when end-user issues become show stoppers, Citrix administration resorts to a resolution path that typically involves “fire-fighting teams”, where experts from each technical silo bring reports from the specific tools they use to a collective meeting and comparing notes in an effort to identify the actual problem.  Often these meetings become “blame storming” meetings where symptoms are once again identified, but not the root cause.   The frustration that Citrix administrators feel is reflected in the chart below.

survey result 4

Root Cause of the continuing Enigma

An unsatisfying Citrix experience can stem from many factors external to the app itself. Issues with Citrix can often be traced to SQL, mass storage, Active Directory, and more. Citrix sessions are highly interactive and if there is a glitch, keystrokes don’t show up on time, the screen refreshes slowly, users may be disconnected and lose their work, and in general, productivity suffers. But more than 80% of the time, the root cause of the problem lies outside the Citrix environment.

Citrix is a delivery technology.  Besides running on its own servers, Citrix interacts with the database servers, virtualization host servers, Storage Area Networks (SANs), web servers, license servers, applications, and network components such as switches and routers. End users call every problem a Citrix problem because every other component remains hidden behind Citrix.  As a result, considerable amount of effort is required to correlate data across multiple expert groups to determine which of these components, including the Citrix servers themselves, actually is the problem. Since this takes time, most Citrix administrators are on the defensive trying to prove that it is not a Citrix problem, rather than trying to resolve the root cause of the problem.

What should an effective Citrix monitoring tool provide?

The best and most effective way to improve the end user experience is to use a tool that measures the actual end-user experience on every device, not one that just infers response time through correlating commodity metrics (that never ends well). Then, through repetitive measurement of these response times, it must automatically develop a baseline of response for any given day and time. Finally, it must automatically alert IT Ops when performance is outside of the baselined norms expected. This gives IT Ops the proactive opportunity, over 80% of the time, to resolve issues before end-users see the slowness which triggers the complaint calls to the Support Desk.

In summary, an effective tool must provide:

  • Auto discovery of all End Users and the Applications & Desktops they are accessing
  • Auto discovery and mapping of the complete stack and service topology without relying on (usually out of date) CMDBs
  • Auto baselining of response times for every user & transaction at any given time & date to give intelligent contextual alerting of end-user experience problems
  • Auto correlation of events across the stack, without having to pull out logs and manually review them all
  • Auto presentation of logon, App access, screen refresh times, etc. for all users and all transactions
  • Auto root cause analytics with clear directions on where the problem is and who is being affected


The list is above a subset of key functionality that AppEnsure delivers to the Citrix administrators, who at last can resolve the puzzle, deliver fast end-user performance experiences and cancel the long standing enigma.

AppEnsure’s Service Level Driven Advantages over Citrix Insight/Director

January 25, 2017 | By: Sri Chaganty, CTO/Founder

advantagesThere has been much discussion about the new parameters that Insight/Director provide with ICA Round Trip Time (RTT).  The general perception is that ICA RTT provides the end-to-end response time for applications or desktops delivered.  This is NOT correct.

Many times the application or VDI published will access the backend infrastructure that supports the application or VDI.  The back-end infrastructure response time is not part of the ICA RTT.

The ICA RTT is a single metric and does not give the hop-by-hop breakdown of the various latencies.

DC Latency is misleading as it includes idle or inactive TCP sessions.  Ideally ICA RTT should be greater than the sum of WAN Latency and DC latency. If the application is not actively sending data, then it does not work as expected. This is because the TCP RTT estimation works only on active connections. If a connection is not very active or if it is idle, the DC latency value will be more than the ICA RTT or WAN Latency.

Independent of Insight/Director

AppEnsure provides the end-to-end response time without any dependencies on the Insight/Director or NetScaler.  AppEnsure’s true end user response times can cross-verify the information that is presented by Director on the ICA RTT for local users.

AppEnsure integrates with Insight/NetScaler and retrieves data that adds intelligence to AppEnsure collected metrics.  The details of integration are described below.

End-to-End & Hop-by-Hop Response Time breakdowns

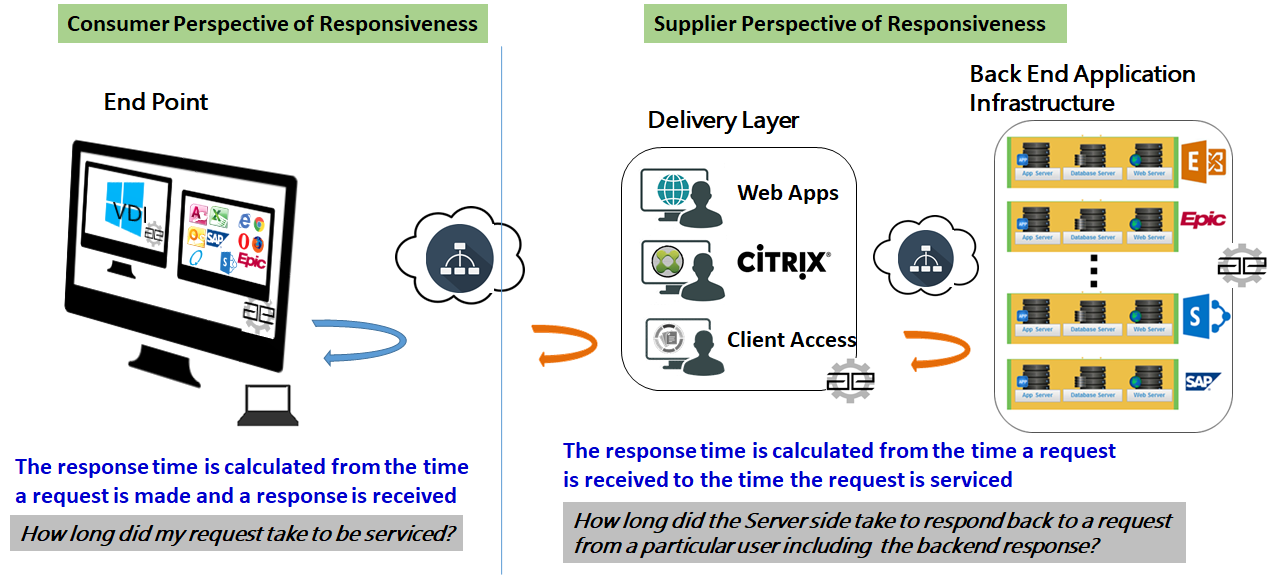
As described earlier, AppEnsure presents the end-to-end response time from an end user’s perspective that identifies the service levels that are being provided to each user for each access of an application or a VDI.  The service level of each access determines the end user’s experience with an application or VDI for every access, which in turn determines the productivity of the work force.  Besides providing the service level for each user, the overall service level of all users is provided to define the overall performance of the delivery of these applications or VDI to the set of users that are accessing the application or VDI.  This comparative metrics enables the users to identify the overall performance of an application or VDI and quickly identify a single user or a set of users that might be experiencing degraded performance.

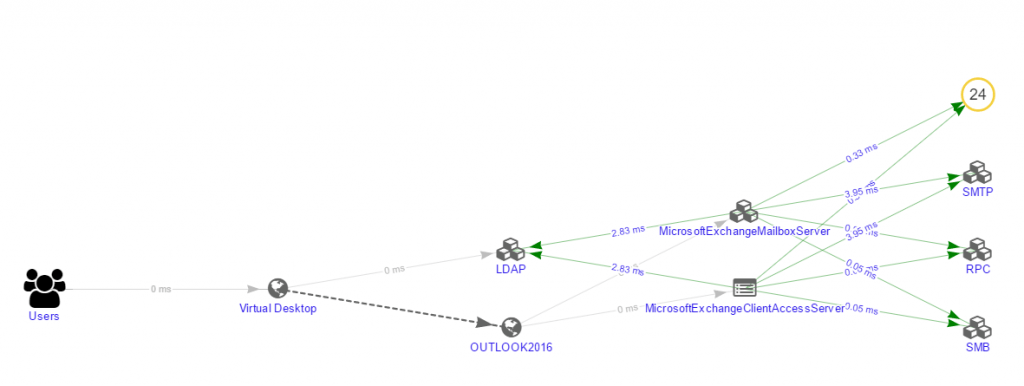
AppEnsure breaks down the overall end-to-end response times into hop-by-hop response times for each user as well as for all the users, at a given time.  This enables the users to identify which hop in the entire service delivery chain of the application or VDI is negatively contributing to the overall end-to-end response time.

The topology map from AppEnsure below, which is automatically discovered by AppEnsure, shows how the end-to-end response times are broken down into hop-by-hop response times for the same example set up described above.

End-to-End

End-to-End & Hop-by-Hop Throughput Breakdown

AppEnsure also provides additional metrics regarding the throughput in terms of calls.  A “call” is the entire transaction from a user to an application or VDI starting from the initial handshake when the user initiates a dialog with the application or VDI by a click, to the point the click is responded back to from the server side, which might include back-end response access as well.  When a call is initiated, the server side might respond back either with results for the request or with an error in the case there is a problem with the request.  AppEnsure identifies both successful and unsuccessful calls (errors) and presents them individually.  This enables identification of which users are experiencing degraded performance due to increased number of errors generated, either from the server side or from the client side.  If a particular user is generating many error calls that the server determines are client errors, AppEnsure identifies such users individually.  In this approach, end user behavior patterns, while accessing an application or VDI, are reflected in the metrics presented by AppEnsure.

Generally, throughput is provided by most solutions in terms of bytes in and bytes out.   This representation does not identify which user is making more calls and which user is making less calls.  Besides, byte representation will not provide information if a single user with a lesser number of calls is dominating the server’s attention, due to the nature of the request made which leads to starvation of resources for other users, who might experience degraded performance.

Call volumes calculated by AppEnsure embed the intelligence to understand the behavior patterns of an application or VDI usage based on the hour of the day, day of the week, week of the month and month of the year.

Back-end Infrastructure Response Times

Many applications published through XA/XD and the VDIs delivered depend upon back-end infrastructure.  In most cases, the applications run on back-end infrastructure and are accessed via an ISS server published on XA/XD.  In other cases, thin clients like Outlook provide access to the back-end mail services.

Back-end infrastructure is sometimes within the data center and in other cases could be a Software as a Service (SaaS) that enterprises subscribe to.  The back-end infrastructure even if hosted within the data center of an enterprise might not be accessible to the Citrix administrators as it is usually managed and maintained by a different group.   In any case, today Citrix administrators have no way to understand the availability and the responsiveness of the back end infrastructure when their customers (end users) are accessing those applications.   AppEnsure provides that visibility, which is not available from the Insight/Director.

Back-end infrastructure responsiveness dictates how the end user is experiencing an application.   Back-end infrastructure responsiveness is dependent upon various factors that include:

  • Load on the application
  • Resources available
  • Availability of infrastructure services that the back-end is dependent upon
  • Time of the day when the access occurs

AppEnsure provides such visibility, which is not available to Citrix administrators or support groups today.

Operational Intelligence

AppEnsure retains unlimited data, unlike Insight/NetScaler, empowering users to harvest this data for operational intelligence of their environment to depict application performance and user behavior patterns.

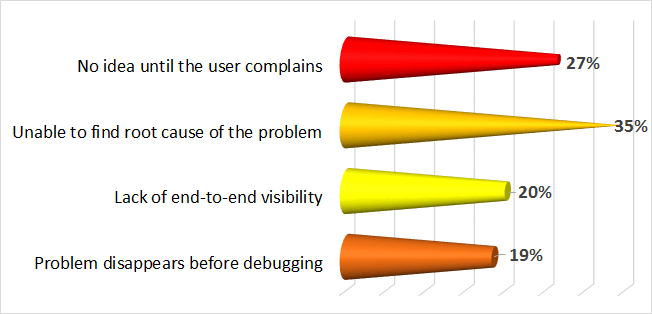
AppEnsure comes with a self-learning baselining of response times for every session in Citrix deployments.   The baselining provides an understanding of how service is being provided to the end users. This in turn establishes the normal conditions when users are not complaining, but also forewarns about abnormal conditions, which today you are dependent on the end users complaining in order to understand there is a performance problem.

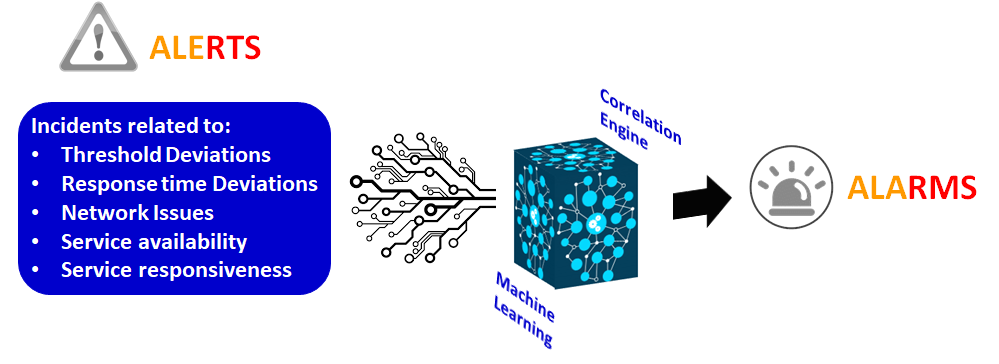
Once normal operational performance is established, desired Service Levels can be defined.  AppEnsure then monitors the performance against the desired service levels and generates an alert and alarms with root cause when such desired service levels are not met by any application or VDI, to any of the users.

Diagnostics

Unlike Insight/Director, AppEnsure does not limit itself to reporting the response times end-to-end and hop-by-hop.  When a response time deviation occurs, AppEnsure performs diagnostics at multiple levels in the service delivery chain and provides the possible root cause for such degradation.

The root cause analysis enables Citrix administrators to quickly identify the location of the problem so that appropriate teams can be alerted to resolve the issue.

Integration with NetScaler/Insight and Director

AppEnsure integrates with Insight/NetScaler.   It fetches the ICA RTT value from NetScaler/Insight along with other parameters listed below.  These values are displayed per ICA session along with the comparative metrics that AppEnsure collects, correlates and displays.  AppEnsure’s screens provide these values in a manner to show how all the sessions are responding in comparison to a single session. The data collected from NetScaler/Insight is also used in diagnostics.

If Insight Center is present, then AppEnsure can be configured to retrieve the following metrics from Insight Center which are displayed as well as used in diagnostics for determining root cause of a performance degradation:

  • ICA Round Trip Time (Client & Server)
  • WAN Latency
  • DC Latency
  • Client Side NS Latency
  • Server Side NS Latency
  • Host Delay

Conclusions

  • AppEnsure offers significant advantages over Insight/Director in monitoring, managing and optimizing the end user experience in the Citrix environments.
  • AppEnsure integrates well with Insight/Director and retrieves relevant data to correlate with its measurements to provide rich diagnostics.
  • AppEnsure provides a new innovative approach in managing real end-user experience in Citrix XenApp(XA) and XenDekstop(XD) environments. AppEnsure uniquely correlates the real end-user response time experience with the application-delivery infrastructure performance, providing contextual, actionable intelligence which can reduce resolution time of application outages and slowdowns by over 95%.

AppEnsure – Independent Solution Review

January 2, 2017 | By: Sri Chaganty, CTO

appensure

Pawel Serwan, organizer of Polish Citrix Users Group, IT enthusiast with a particular interest in Microsoft and Citrix technologies who is currently working as Citrix Administrator at Brown Brothers Harriman published an independent review of AppEnsure solution on his blog based on his testing of the product.

According to Pawel, “Today every Citrix administrator has to work with multiple technologies: hypervisors, application servers, file servers, network etc. To be able to act proactively or to troubleshoot the problem we have to check multiple tools, view many dashboards and analyze many charts. That is why I was really glad to see that AppEnsure decided to simplify their graphical interface and make it clean. Thanks to that the welcome screen is not cluttered with all possible charts and alerts coming from your servers.” He concludes in his review, “AppEnsure monitoring solution is a powerful tool that should find usage in many IT environments.”

AppEnsure empowers you to measure and increase the user productivity in Citrix Deployments with an end-user centric approach. Are you having challenges with finger pointing war room meetings, blamestorming sessions, network team complaining about bandwidth, or application downtime? Read Pawel’s review to understand how AppEnsure can help you to face such challenges.

Here is the LINK to his blog post.

Time is Money

September 7, 2016 | By: Robin Lyon, Director of Analytics


Time is an important measurement of IT service, especially we use transaction time.  Time is well understood and begins to answer some of the fuzzy questions such as slowness and what is performance.  Of course there are other great questions in IT and one of the most dreaded is: ‘How much does this application cost?’  This question creates countless man hours of work quickly running into the diminished returns of hours spent vs. accuracy.   Here is an enumerated example:


1.       The cost of the actual application (license, lease etc.) + depreciation as appropriate.

2.       The cost of maintenance agreements.

3.       The cost of the man power supporting the application (often fractions of various head count.)

4.       The cost of the dedicated hardware supporting the application.

5.       The proportion cost of shared hardware and software such as Databases and SAN space.

6.       The proportion cost of network equipment + and then network support hours.

7.       The cost of data center space + power + environment.

8.       The proportional cost of management.

9.       The cost of shared services such as backup and monitoring.

10.   …

As you can see this becomes quite a long list and rapidly becomes time intensive.   I remember one organization that spent days deciding how to divide the data center power bill into the application numbers.  The humorous or sad reality is thousands of dollars of time in meetings was used to shift increments of hundreds of dollars between the applications.  What was disturbing is at the end of weeks of work by most of IT is a reasonable number was returned but what it didn’t show was one of the greatest and most forgotten costs of an application, that of user time.  There are good reasons for this such as user time is not part of the IT budget or how could we possible calculate that number to any accuracy.


Now that we have a method to understand transaction time we can understand the cost of slow application.  A simple formula is the number of transactions * the average transaction time * the cost of loaded headcount per time.  This is not perfect nor do I want to make perfection the enemy of good.  It is reasonable to say if a user waits more than a minute for a result they start multitasking.  This can be corrected by ignoring transactions longer than one minute for this simple formula.   There are other exceptions and all can be corrected for but let’s take an example application and figure out some numbers.


We have an application that 600 users use 60 times a day with an average transaction time of 10 seconds.  That comes out to 36,000 transactions or 360,000 seconds or 100 hours.  HR tells us that our loaded headcount is 40 dollars an hour so we have $4,000 per day of lost time spent waiting for application response.   This is a shocking number; it often exceeds the total cost from the tedious exercise of calculating an application cost.   Other ways to think of this number are $88,000 per month or 12.5 people doing nothing but waiting every single day.


Fortunately, with information comes opportunity.   There are several beneficial ways to use this discovered cost.  One way is it may help reluctant organizations understand the importance of IT and good systems.  When the cost is presented to the application owner they might want to invest in improving application performance.  Assume when looking at the application performance we find most the time is spent in the data base.  After a bit of testing we can see a 25% increase of performance by moving to a DB cluster and the cost of doing this is $100,000.  Using our $88,000 cost of time per month we calculate the DB improvement pays for its self in 5 months ($88,000 * .25 * 5 = $110,000) in increased productivity.


This number is also a key management number.  During the year end budget and priority cycle there are several ways to decide how to assign the all too few resources given to IT.  Other than compliance and obsolescence a strong argument is improving what will gain the most productivity and money is the understandable measure to use.


Businesses run by understanding costs.  Application management allows IT to start speaking the same language as rest of a company – one of dollars and cents.  An old basic business adage is you can’t manage what you don’t measure.   Appensure is an example of a time based performance tool that discovers the unknown cost and enables efficient management.

End-User Experience Management Podcast on DABCC Radio

September 2, 2016 | By: AppEnsure

End-User Experience Management Podcast on DABCC Radio

DABCC was founded by Douglas Brown on January 12, 1999 with one simple goal, to find and share the important news and support resources. Thus giving the IT Professional one location to find the industries best information.


Douglas Brown interviews Sri Chaganty, CTO & Co-Founder of AppEnsure. Sri and Douglas discuss the AppEnsure end-user experience management solution. Sri explains why they decided to get into this APM space, how AppEnsure works, why it is different than other APM solutions, how it works within Citrix environments, and much more. AppEnsure was one of the first Citrix Startup Companies and in this podcast you will understand why!


Performance Stumbling Blocks in Desktop Virtualization

August 23, 2016 | By: Reinhard Travnicek, Managing Director, X-Tech

This article talks about end-user expectations in terms of felt or experienced performance of applications or desktops delivered by technology which is called VDI, Desktop Virtualization, Remote Desktop, App Virtualization … you name it.

There are a lot of marketing names out there for a technology which basically separates the presentation layer (GUI) of an application from the processing logic. There are also a large number of different protocols and products on the market to achieve this split and build manageable, user-friendly environments.

At the end of the day the end-user gets either the GUI of an application or a complete desktop including the application GUI that are delivered via a remoting protocol. From an end-user performance point of view this application or desktop should perform equal to or better than what could be expected from a locally installed application or desktop.

One of the main reasons VDI implementations don’t make it off the ground is that users don’t like how virtual machines perform.

Performance Stumbling Blocks

Where are the stumbling blocks to delivering good perceived performance?

Login: When starting a remote desktop or a remote application a complete login into the environment must be performed. For a desktop it is generally accepted that a login takes 15 to 30 seconds. Since login is performed only once a day in most environments, login to desktops (if configured and optimized correctly) is never an issue.

The same login process (up to 30 seconds) becomes a problem if this time is needed to start up a single remote application because the user would expect the application to start instantaneously. Advanced VDI products include support for techniques called prelaunch, which perform a hidden login and therefore prelaunch a session context in which the remote application can then start as quickly as a local application.

Logoff: with the advent of the sleep and hibernate functions in modern operating systems, users are not used to performing logoff actions frequently. VDI, however, relies on freeing resources (because resources are shared) therefore logoff must be performed.  The time it takes to logoff could be hidden from the end-user by disconnecting the screen first and then performing the logoff actions in the background. Most of the logoff duration is determined by the time needed to copy roaming profiles.  

Roaming Profiles: A VDI environment is most likely built on some kind of roaming profile. Since the user’s session context is built on random least used resources, roaming profiles are key for a consistent user experience. Unfortunately, even modern software does not entirely support roaming (Microsoft OneDrive cache, for example, is stored locally in non-roaming %Appdata%\local). Since profiles must be copied in during login and copied (synced) out during logoff, a small profile and folder redirection is recommended.

Device remoting: USB, pervasive use of resource-heavy webcams, and softphones make support of peripherals for virtual desktops a moving target.

Supporting peripherals is key to the virtual desktop user experience. Without access to their familiar printers, cameras, USB ports and other peripherals, users won’t be as hot to accept desktop virtualization. As an administrator, you need to know which peripherals are out there and how to support them in a virtual desktop environment. And most of all you need to know what the end-user performance is with these devices once the VDI solution is in place.

Remote Access: If the VDI environment is accessed over a WAN connection there are several parameters to consider. At first, everybody thinks about bandwidth. Limited bandwidth used to be the predominant source of network issues impacting user experience. But latency, or the connection’s quality (i.e. packet loss), are usually more crucial.

For today’s mobile worker the biggest issue is spectral interference. In a downtown office building, there are Wi-Fi networks on the floors above and below you and across the street. They are all creating constructive and destructive interference patterns that result in dead zones, high packet loss and degraded interactivity. End-user performance is heavily influenced by this packet loss, even when the end device shows strong network signal levels and sufficient bandwidth is available. 

Latency on long distance connections (datacenter in US while the user is in China) adds another problem to the VDI user experience scenario. By definition there is a protocol in place which separates the presentation layer (GUI) from the processing layer. So, it is easily understood that when the user is on a WAN connection with high latency (> 150 ms) the user will notice delays while typing even in simple programs like editors or data entry masks of CRM tools. Latency caused by distance cannot be influenced but one can work on some of the symptoms which are inherited from TCP/IP protocol. Here WAN optimization products do help.  

Why does VDI require its own monitoring tools?

You can’t use your server monitoring tools for VDI performance monitoring. The goal of monitoring virtual desktops must be to assess the user experience, while with most monitoring tools on the market you’re generally documenting resource usage. Plus, virtual desktop workloads change significantly more often than those of traditional PCs or servers, so you have to monitor them more closely and frequently.  Look for a tool that monitors end-to-end (frontend to the backend servers) connectivity and offers metrics about the network, the physical machines and the virtual machines.

A monitoring solution designed with end-user transactional performance in mind provides IT Ops with application and virtual desktop performance monitoring that is correlated with user productivity. Armed with this data, IT Ops can rapidly investigate users’ complaints of poor app performance, determine other impacted users and the likely root causes. Then they can resolve the issue before workforce productivity is impacted. For that reason, IT organizations will increasingly be using performance metrics such as application and transaction response times. These end-user experience indexes allow IT to monitor the speed of applications and to evaluate the quality of the end-user experience.

Passive end-user application performance measuring systems and solutions supported by plenty of CPU resources, network bandwidth to spare, affordable storage space and Big Data analyses are able to provide a seamless end user desktop virtualization experience.


Baseline Before You Jump

August 5, 2016 | By: John Ward, Head of Sales


http://sd.keepcalm-o-matic.co.uk/i/keep-calm-and-take-baseline-data-1.png

Even though you might feel like you understand your current application performance, you’ll likely be surprised at what your real “normal” response times are when you start measuring them.


If you’re responsible for rolling out new versions of software, obviously you will want to know what your typical end user experience is with the old version beforehand. The last thing you want to do is to roll out the latest and greatest version of any application, and have it be a worse performing edition than the previous one.


You will want to know what affect the new version could have on the infrastructure resources before rolling it out. Whether you are responsible for the back end applications or the front end delivery via something like Citrix, you will need a monitoring and diagnostics tool that not only has you examine performance within your test environment though also allows you to observe it within a pilot production sampling to ensure your application rollout is ready for prime time and optimal performance. Then, let the jumping begin!